The caliber of pro triathlon has exploded coming out of a couple pandemic-limited race seasons. More pro triathletes are swimming, biking and running faster than ever. I feel the urgency to continually level up or get left behind, especially after a tough season.
Over the full distance, sub-8 hours for men and sub-9 hours for women used to be a big deal. Just a decade ago, only a couple dozen men and women had broken these barriers. More recently, these benchmarks have become the norm on all but the most brutal courses and, sometimes, not even enough to podium or Kona qualify.
I’ve noticed this rise in competition most dramatically on the bike. I’ve improved across all three disciplines over my eight years racing pro, but I’ve still lost ground on the bike relative to the best. Being competitive on two wheels demands not only a new standard of fitness, but also a new degree of tech optimization and tactical acumen. Here’s a look at what it takes.
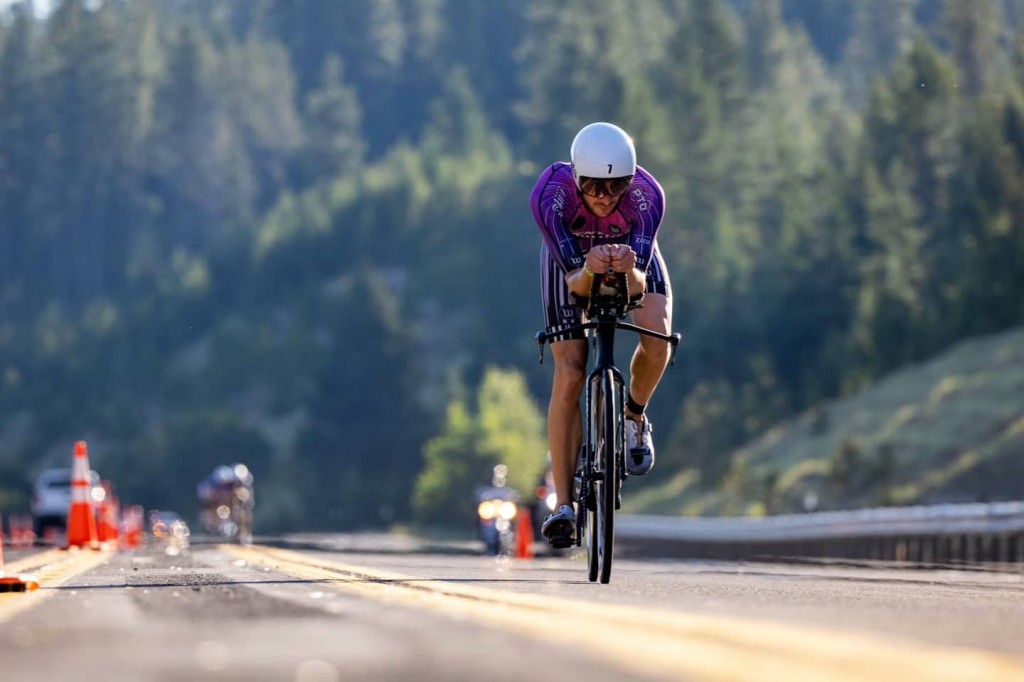
Power file analysis: IRONMAN Chattanooga
I got schooled in this new standard at IRONMAN Chattanooga (4th, 8:00:07). Both the men’s and women’s course record fell by over 20 minutes. Four men were well below the previous mark of 8:08 (granted, it was a cooler day than usual and a stronger field due to the postponement of Kona).
Related: IRONMAN Chattanooga Pro Race Coverage: Part I and Part II
Chattanooga featured three of the strongest cyclists in triathlon: Joe Skipper, Lionel Sanders and Sam Long, plus the very well-rounded Ben Hoffman. I had a personal best ride and still lost 3 to 9 minutes to Joe, Lionel and Sam on the bike. Check out the ride on Strava (the bike course is long: ~186km / 116mi).
Here’s how my average power (AP) and normalized power (NP) compared to the IRONMAN races I’ve won (at 70-72 kg).
- IRONMAN Chattanooga 2021: 4th, 4:23:54, AP 277W, NP 288W, Strava
- IRONMAN Mont Tremblant 2019: 1st, 4:20:54, AP 275W, NP 287W, Strava
- IRONMAN Chattanooga 2018: 1st, 4:20:25, AP 266W, NP 273W, Strava (canceled swim)
- IRONMAN Mont Tremblant 2018: 1st, 4:24:28, AP 262W, NP 273W, Strava
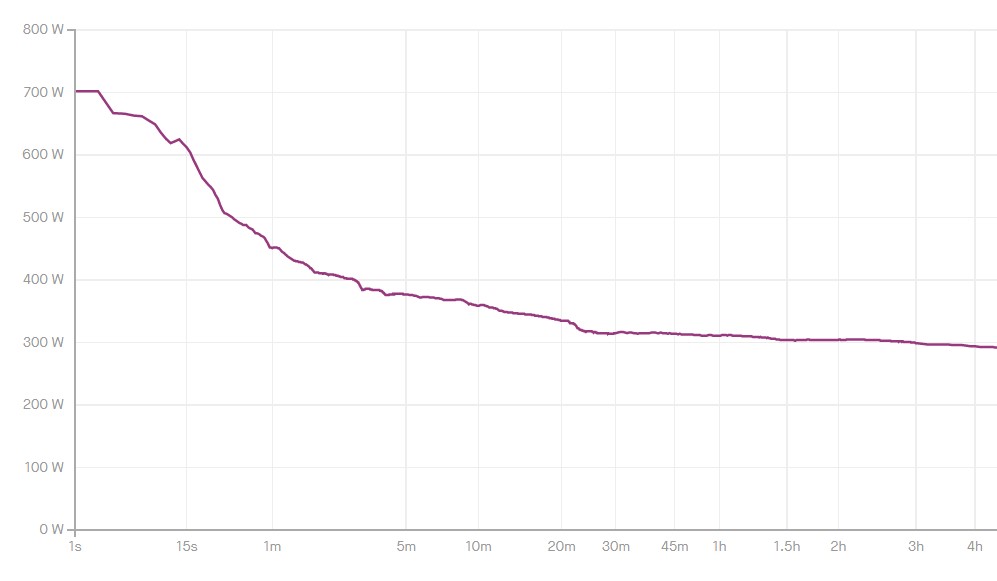
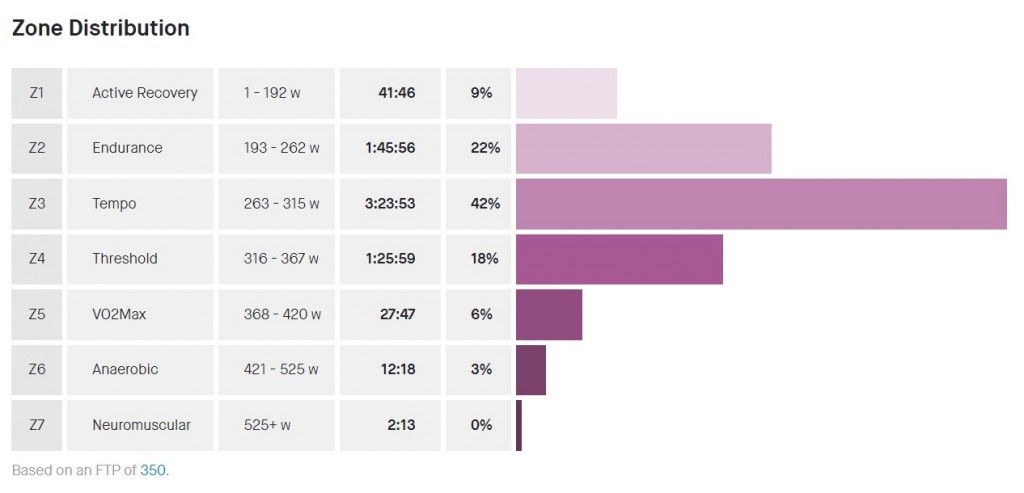
One of most striking things about this power file is how far from a steady effort it is! The variability index of 1.04 isn’t particularly high for a hilly course, but the peak power curve and zone distribution tell a different story. Parts of this race look more like a sprint than an IRONMAN; 10% of the ride was above threshold with peaks of 1:00 at 451W, 5:00 at 377W, 20:00 at 335W.
This ride wasn’t perfectly executed, but I wouldn’t have changed much. After a good swim, I started the ride alone at the front until Joe, Sam and Ben soon caught up. The pace was suspiciously comfy for a while before a series of brutal surges near the halfway mark that eventually gapped me and Ben. The second lap was like Mario Kart dodging age groupers, traffic, bumps and gear strewn on the road.
I anticipated such “spiky” power and prepared for it. I set up a decent marathon, moving into 2nd before limping to 4th with an achilles injury that’s been dogging me all season. I’d rather take calculated risks to go for the win than play it safe.
Here’s another look at the variability and tactical demands of the pro race from IRONMAN Tulsa, the 2021 North American Championship. My day there ended abruptly with a double flat, but not before this rollercoaster…
In an earlier post, I also shared power file analyses for ten races from 2016 to 2018, including five IRONMAN 70.3 wins and five fastest bike splits. Looking back, these past performances wouldn’t be enough to break away or win typical 70.3 races just a few years later.
What about FTP and TSS? I don’t really use the concepts of Functional Threshold Power or Training Stress Score to plan or analyze my training or race pacing. That said, I’d estimate my FTP at peak form in aero position to be around 350 to 365W (~5.0-5.1W/kg). That translates to a TSS of close to 300 for that Chattanooga ride.
Tactics and drafting
These aggressive rides initially caught me off-guard. As an iron-noob, I assumed that full distance racing would play out more like an individual time trial. I figured that everyone would stick to their plan and carefully guard their energy.
It was eye-opening racing my first deep IRONMAN fields (IMFL ’20, Tulsa ’21). Race dynamics dictated a different game plan and approach to training. The more competitive the field, the more athletes respond to one another. My tactical playbook became less about hitting certain numbers and more about how I’d react to various scenarios—if this, then that…
The strategic value in hanging with, dropping or bridging up to other athletes on the bike is rooted in the physics of aerodynamics. There’s a decisive draft benefit even at the standard 12 meter spacing allowed between cyclists. This benefit grows significantly the deeper athletes are in a legally spaced pack or the closer athletes stray into that “12 meter” zone (without copping a penalty).
A 20 meter draft zone—proposed for years and tested at some races—would fundamentally change the way that races play out, for better or worse depending on whom you ask.
Related: Anatomy of an IRONMAN Win: Part I and Part II
The role of tech
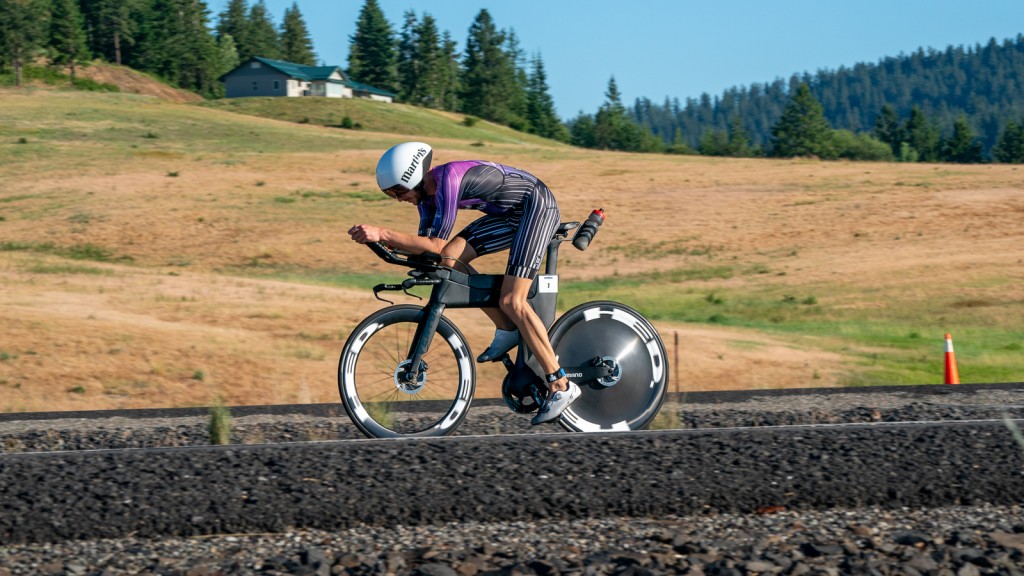
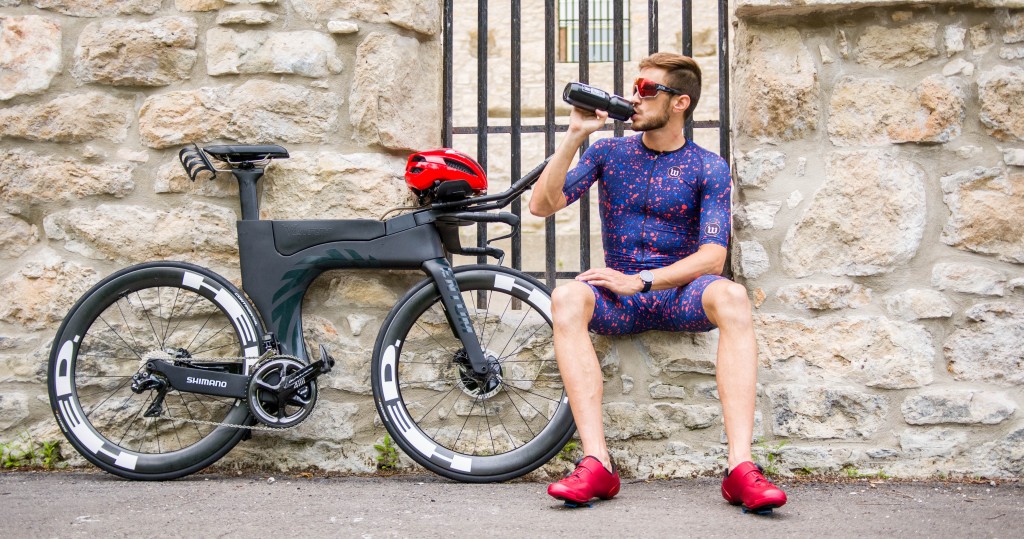
On top of increasing fitness, advancements in bike tech and awareness account for some of the overall improvement in bike performance. I lament the days when pro triathletes who worshipped at the altar of aerodynamic efficiency and rolling resistance were the exception. (Seriously, athletes used to win races rolling Gatorskins!) As a rookie, I took my cues from the handful of athletes like Jordan Rapp who were meticulous about tech before it was cool. Now, a highly optimized position and setup are par for the course.
Here’s what I’m running lately:
- Frameset: Ventum* One Disc
- Components: Shimano* Dura Ace Di2
- Power meter: 4iiii* Precision Pro
- Wheelset: HED* Vanquish RC Pro
- Tires: Continental Grand Prix 5000TL 25c
- Helmet: Louis Garneau P-09
- Kit: Wattie Ink* Champion 2.0 Custom
Since the start of my pro career, I’ve been unwilling to compromise on “mission critical” equipment like bike gear. I’d rather buy exactly what I need and hold out on sponsorship* until I can land a deal that doesn’t require a performance tradeoff.
I’ve also been fortunate to do several rounds of aero testing in the wind tunnel, 4iiii Virtual Wind Tunnel (visualized below) and some field testing with Endurance Innovation and Aerotune. Aero testing inevitably leaves me with more questions than answers, but it’s been helpful to explore parameters like stack and reach, hand positions and helmets.
Chattanooga was a motivating note to end my season on. This new standard of competition drives me to get more out of myself.
Questions or comments? Hit me up on Instagram.
